RSI Technical Trading Indicator for Day Trading

The Relative Strength Index (RSI) is a popular technical trading indicator that is widely used in the stock market, cryptocurrency, Forex, and other markets. RSI measures the strength of price changes in an asset by comparing the magnitude of recent gains to recent losses. The indicator can be used to determine whether an asset is overbought or oversold and can provide valuable insights into future price movements. In this article, we will discuss the basics of RSI and how it can be used for day trading in various markets.
The RSI was developed by J. Welles Wilder in 1978 and is one of the most widely used momentum indicators. It uses a mathematical formula to calculate the strength of price movements and compares the magnitude of recent gains to recent losses. The RSI ranges from 0 to 100, with values above 70 considered overbought and values below 30 considered oversold.
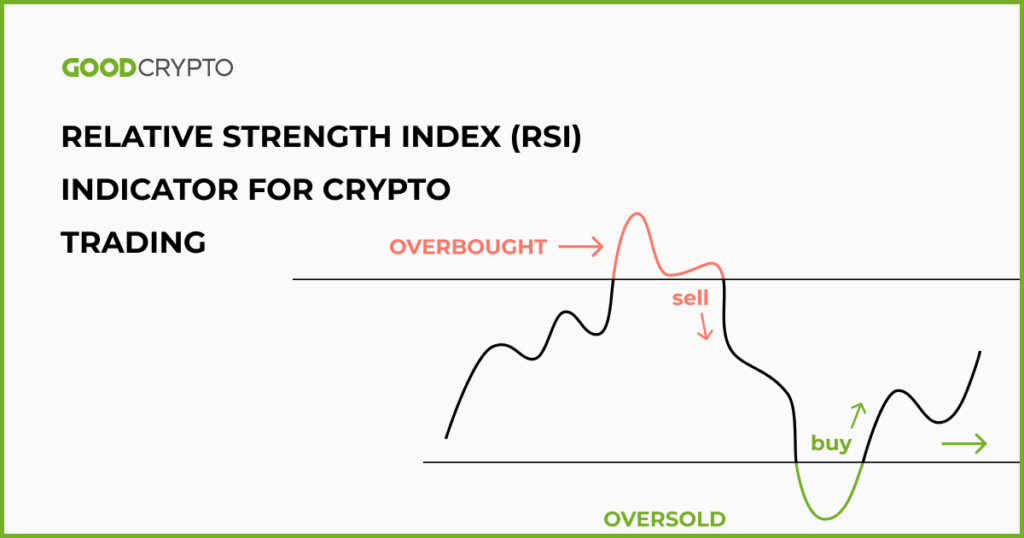
One of the primary ways that traders use the RSI is to identify overbought and oversold conditions. When an asset's RSI is above 70, it means that the price has been rising faster than normal and may be due for a pullback. Conversely, when an asset's RSI is below 30, it means that the price has been falling faster than normal and may be due for a rebound. These conditions can provide opportunities for traders to enter or exit positions based on their market outlook.
Another common use of RSI is as a momentum indicator. When an asset's RSI is rising, it suggests that the underlying asset is gaining momentum and may continue to rise. Conversely, when the RSI is falling, it suggests that the underlying asset is losing momentum and may continue to fall. Traders can use this information to identify trends and make informed trading decisions.
In addition to identifying overbought and oversold conditions and momentum, the RSI can also be used to identify potential trend reversals. For example, if an asset's RSI is above 70 and then falls below 70, it may suggest that the uptrend is coming to an end and a downtrend may be starting. Conversely, if an asset's RSI is below 30 and then rises above 30, it may suggest that the downtrend is coming to an end and an uptrend may be starting.
One of the key benefits of using RSI for day trading is its ability to provide early signals of potential price changes. Since the RSI is a momentum indicator, it can provide traders with valuable information about the strength of price movements and can be used to identify potential trends before they become obvious. This can be especially useful in fast-moving markets such as cryptocurrency and Forex where price changes can occur rapidly.
Another benefit of using RSI for day trading is its versatility. The indicator can be used in a variety of markets, including cryptocurrency, Forex, stocks, and commodities. This means that traders can use the same indicator in multiple markets and can easily transfer their trading strategies from one market to another.
In conclusion, the RSI is a versatile and widely used technical trading indicator that can provide valuable insights into price movements and market trends. By using RSI to identify overbought and oversold conditions, momentum, and potential trend reversals, traders can make informed trading decisions and increase their chances of success. Whether you are day trading in cryptocurrency, Forex, stocks, or any other market, the RSI can be a valuable tool in your trading arsenal.