50-200 Day Moving Averages Impact

Technical Trading Indicators: 50-Day Moving Average and 200-Day Moving Average
Moving averages are a popular tool used by technical traders to analyze financial markets. Two commonly used moving averages are the 50-day moving average and the 200-day moving average. These moving averages provide traders with important signals about the trend and momentum of the market.
The 50-day moving average is a short-term indicator that is used to determine the current trend of the market. It is calculated by adding up the closing prices of the last 50 days and dividing the result by 50. The 50-day moving average is a popular tool for traders because it provides a quick and simple view of the market trend.
The 200-day moving average is a long-term indicator that is used to determine the overall trend of the market. It is calculated by adding up the closing prices of the last 200 days and dividing the result by 200. The 200-day moving average is a popular tool for traders because it provides a more complete view of the market trend over a longer time period.
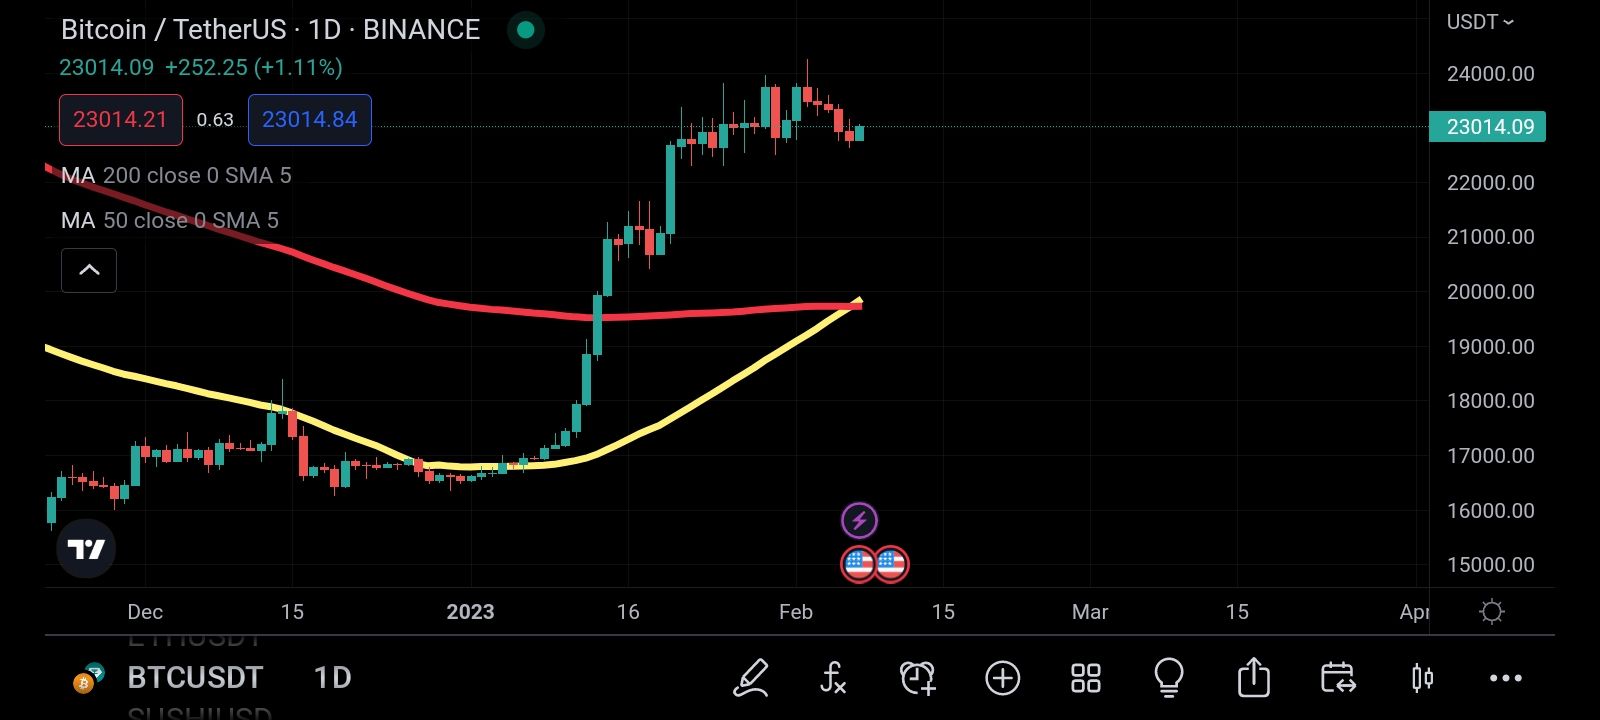
The intersection of the 50-day and 200-day moving averages can signal important changes in market trend. When the 50-day moving average crosses below the 200-day moving average, it is called a "death cross." This is a bearish signal that indicates that the short-term trend is bearish and that prices are likely to continue to fall.
On the other hand, when the 50-day moving average crosses above the 200-day moving average, it is called a "golden cross." This is a bullish signal that indicates that the short-term trend is bullish and that prices are likely to continue to rise.
In conclusion, the 50-day and 200-day moving averages are important technical trading indicators that provide traders with important signals about market trend and momentum. The death cross and golden cross are significant events that occur when the 50-day moving average crosses the 200-day moving average and provide traders with important signals about the direction of the market.