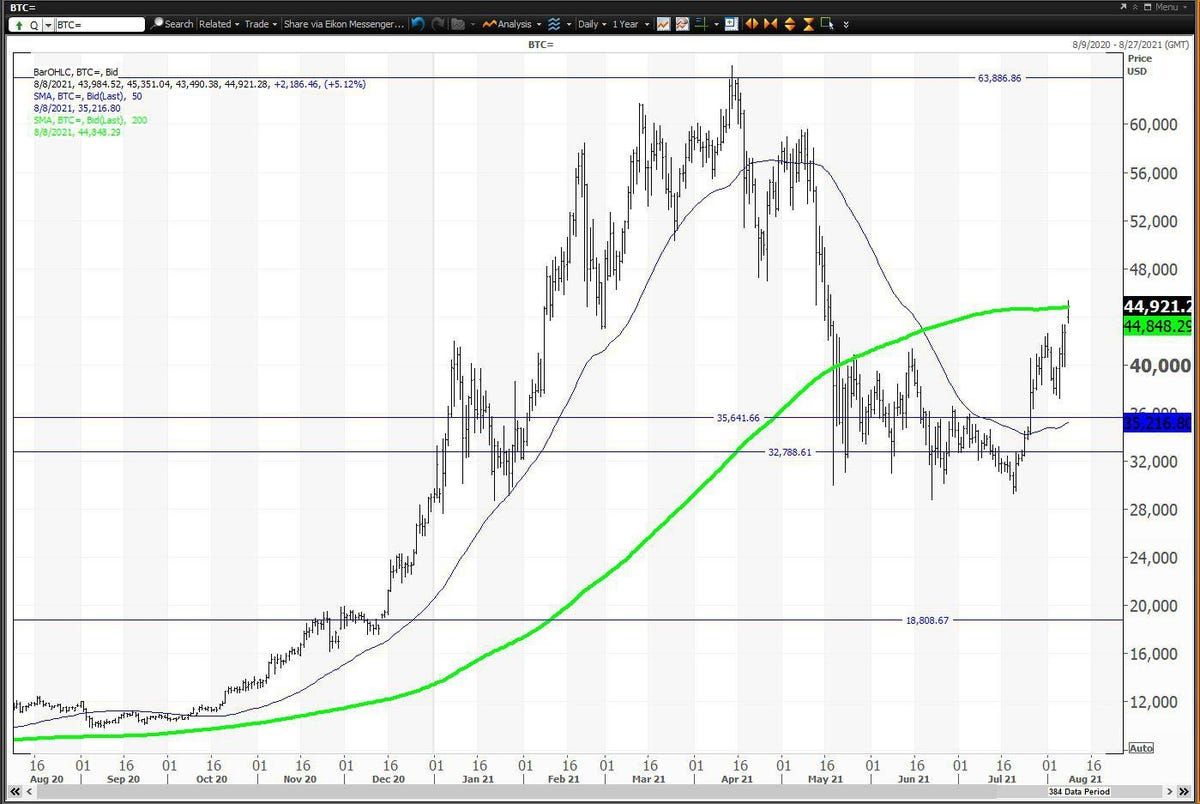
200 Day Moving Average in Trading

Technical analysis is a method of evaluating securities by analyzing statistical trends gathered from trading activity, such as past prices and volume. One of the popular tools used in technical analysis is the moving average. Moving averages provide a smoothed representation of the price action, helping traders identify trends and potential areas of support and resistance.
In this article, we will explore the use of moving averages, specifically the 200-day moving average, in the cryptocurrency, forex, stock market, and commodities markets.
Cryptocurrency: In the cryptocurrency market, the 200-day moving average is widely used as a key trend indicator. A cryptocurrency price is considered bullish when it is trading above its 200-day moving average, and bearish when trading below it. If the price crosses above the 200-day moving average, it is often interpreted as a bullish signal, while a crossover below the moving average may be seen as a bearish signal. Additionally, the 200-day moving average can act as support or resistance, with traders looking to enter long positions when the price is near the moving average and short positions when it is trading below it.
Forex: The 200-day moving average is also used in the forex market, where it is commonly referred to as the "big picture" trend indicator. In forex trading, the 200-day moving average is used to determine the overall trend of a currency pair. A currency pair is considered bullish when trading above its 200-day moving average, and bearish when trading below it. Traders may also look for crossovers of the currency pair's price with the 200-day moving average as potential entry or exit points.
Stock Market: In the stock market, the 200-day moving average is a widely followed trend indicator. The stock price is considered bullish when trading above its 200-day moving average and bearish when trading below it. The 200-day moving average can also act as a level of support or resistance, with traders looking to enter long positions when the price is near the moving average and short positions when it is trading below it.
Commodities: The 200-day moving average is also used in the commodities market, where it is commonly used to identify the trend in commodity prices. A commodity is considered bullish when its price is trading above its 200-day moving average, and bearish when trading below it. The 200-day moving average can also act as a level of support or resistance, with traders looking to enter long positions when the price is near the moving average and short positions when it is trading below it.
The 200-day moving average is a widely used tool in technical analysis for trading, providing a smoothed representation of the price action in the cryptocurrency, forex, stock market, and commodities markets. It is used to determine the overall trend, identify potential areas of support and resistance, and provide entry and exit signals. However, it is important to note that moving averages should not be used in isolation and should be combined with other technical analysis tools and indicators to form a complete trading strategy.
